Predictive value of monocyte-to-high-density lipoprotein ratio for all-cause mortality in maintenance hemodialysis patients
-
摘要:目的
探讨单核细胞/高密度脂蛋白(high density lipoprotein,HDL)比值(monocyte-to-high density lipoprotein ratio,MHR)对维持性血液透析(maintenance hemodialysis,MHD)患者全因死亡的预测价值。
方法选取2014年11月至2020年11月南京市中心医院血液净化中心收治的MHD患者100例,随访至研究终点,死亡24例、生存76例,比较死亡组和生存组患者的一般情况、各实验室指标、MHR、中性粒细胞/淋巴细胞比值(neutrophil-to-lymphocyte ratio,NLR)、单核细胞/淋巴细胞比值(monocyte-to-lymphocyte ratio,MLR)、血小板/淋巴细胞比值、C反应蛋白(C-reactive protein,CRP)/白蛋白比值(C-reactive protein-to-albumin ratio,CAR)的差异。采用Logistic回归分析MHD患者死亡的影响因素。根据MHR中位数将患者分为高MHR组(n = 50)和低MHR组(n = 50),采用Kaplan-Meier法进行生存分析。采用受试者工作特征(receiver operating characteristic,ROC)曲线评估相关指标对MHD患者全因死亡的预测价值。
结果死亡组患者年龄[77.00(71.25,85.75)岁比64.00(52.25,73.75)岁]大于生存组(P<0.05);死亡组患者合并糖尿病比例(54.17%比28.95%)、NLR[5.059(2.959,5.961)比3.582(2.746,4.468)]、MLR[0.391(0.300,0.493)比0.317(0.227,0.411)]、CRP[5.475(2.368,7.350)mg/L比2.410(1.025,5.475)mg/L]、CAR[0.142(0.062,0.208)mg/g比0.061(0.027,0.144)mg/g]、MHR[0.457(0.340,0.598)比0.328(0.241,0.454)]高于生存组(P<0.05),HDL[0.840(0.725,1.018)mmol/L比1.010(0.813,1.280)mmol/L]低于生存组(P<0.05)。Logistic回归分析提示年龄和MHR是MHD患者全因死亡的危险因素。高MHR组患者总体生存率低于低MHR组(χ2 = 6.657,P<0.05)。ROC曲线结果提示MHR、CAR、NLR、MLR以及四者联合均对MHD患者具有预测价值,AUC分别为0.694、0.691、0.650、0.647、0.740(P均<0.05)。
结论MHR对MHD患者全因死亡具有临床预测价值。
Abstract:ObjectiveTo explore the predictive value of monocyte-to-high-density lipoprotein (HDL) ratio (MHR) for all-cause mortality in maintenance hemodialysis (MHD) patients.
MethodsFrom November 2014 to November 2020, 100 MHD patients admitted into Blood Purification Center were recruited. At the end of the study, 24 patients died and 76 survived. The inter-group differences of general profiles, laboratory parameters, MHR, neutrophil-to-lymphocyte ratio (NLR), monocyte-to-lymphocyte ratio (MLR), platelet-to-lymphocyte ratio (PLR) and C-reactive protein (CRP)-to-albumin ratio (CAR) were compared. The influencing factors of death were analyzed by Logistics regression. Based upon the level of median MHR, they were divided into two groups of high MHR (n=50) and low MHR (n=50). Survival analysis was conducted by the Kaplan-Meier method. Receiver operating characteristic (ROC) curve was plotted for assessing the predictive values of the relevant parameters for all-cause death.
ResultsPatients were older in death group than those in survival group [77.00(71.25, 85.75) years vs 64.00(52.25, 73.75) years, P<0.05]. The proportion of patients with diabetes (54.17% vs 28.95%) and levels of NLR [5.059(2.959, 5.961) vs 3.582(2.746, 4.468)], MLR [0.391(0.300, 0.493) vs 0.317(0.227, 0.411)], CRP [5.475(2.368, 7.350) mg/L vs 2.410(1.025, 5.475) mg/L], CAR [0.142(0.062, 0.208) mg/g vs 0.061(0.027, 0.144) mg/g] and MHR [0.457(0.340, 0.598) vs 0.328(0.241, 0.454)] were higher in death group than those in survival group (P<0.05). The level of HDL was lower in death group than that in survival group [0.840(0.725, 1.018) mmol/L vs 1.010(0.813, 1.280) mmol/L, P<0.05]. Logistic regression analysis indicated that age and MHR were risk factors for all-cause mortality. Overall survival rate was lower in high MHR group than that in low MHR group (χ2=6.657, P<0.05). ROC curve implied that MHR, CAR, NLR, MLR and their combinations had predictive values for MHD patients. Area under curve (AUC) was 0.694, 0.691, 0.650, 0.647 and 0.740 respectively (P<0.05).
ConclusionsMHR has clinical predictive value for all-cause mortality in MHD patients.
-
Keywords:
- Hemodialysis /
- Monocyte /
- High density lipoprotein /
- Prediction
-
随着透析技术的不断发展,维持性血液透析(maintenance hemodialysis,MHD)患者的生存时间逐渐延长。然而,MHD患者的病死率仍然很高。研究发现,微炎症状态在终末期肾病患者开始透析前就已经存在,其与MHD患者临床不良结局(全因病死率、心血管事件、蛋白质能量消耗障碍等)的发生发展密切相关[1-2]。尽管只有小于5%的MHD患者直接死于炎症,但炎症可与多种风险因素相互作用,对MHD患者的预后有着重要影响[3]。单核细胞/高密度脂蛋白比值(monocyte-to-high density lipoprotein ratio,MHR)已成为一种易于计算且易于获得的新型炎症标志物。MHR被证明能够独立预测各种患者群体的病死率和主要心脏不良事件,包括但不限于慢性肾脏病、脑卒中、急性冠脉综合征和冠状动脉疾病[4]。另外,其他新的炎症标志物同样备受关注,包括中性粒细胞/淋巴细胞比值(neutrophil-to-lymphocyte ratio,NLR)[3,5-6]、单核细胞/淋巴细胞比值(monocyte-to-lymphocyte ratio,MLR)[3,7]、血小板/淋巴细胞比值(platelet-to-lymphocyte ratio,PLR)[3,5,8]、C反应蛋白/白蛋白比值(C-reactive protein-to-albumin ratio,CAR)[9]。本研究旨在观察MHR与MHD患者全因死亡的关系以及同其他新型炎症因子进行对比,为MHR评估MHD患者预后提供依据。
对象与方法
一 研究对象
选取2014年11月至2020年11月南京市中心医院血液净化中心收治的100例MHD患者为研究对象,对其资料进行回顾性分析。纳入标准:(1)在我院血液净化中心规律行血液净化治疗≥3个月;(2)年龄>18岁;(3)病历资料及化验检查结果登记保存完整;(4)能通过随访、电话等方式记录患者预后。排除标准:(1)伴有严重感染性疾病、全身免疫性疾病、血液系统疾病;(2)患有恶性肿瘤疾病;(3)长期接受糖皮质激素或免疫抑制剂治疗;(4)未规律随访,无法获得各项实验室指标者。所有纳入患者,根据到达研究终点时是否死亡,分为死亡组和生存组;根据MHR中位数分为高MHR组和低MHR组。本研究获得南京市中心医院伦理委员会批准(编号:2019伦审02号)。
二 研究方法
患者使用德国费森尤斯4008s血液透析机,采用一次性聚砜膜或聚醚砜膜透析器,透析器膜面积1.5~1.8 m2,给予个体化处理方案。透析液组成:钾离子浓度2.0~4.0 mmol/L、钠离子浓度135~145 mmol/L、钙离子浓度1.25~1.75 mmol/L、镁离子浓度0.75 mmol/L和碳酸氢盐浓度32.0 mmol/L。透析液流速为500 mL/min,透析液温度为36~37 ℃。根据患者血管通路情况设置血泵转速为200~300 mL/min。患者接受每周2~3次、4 h/次的规律血液透析治疗。
三 一般资料及实验室指标
收集患者纳入时的一般资料及稳定透析3个月后的实验室检查指标,包括:人口学资料、透析相关情况、是否合并糖尿病、原发病、透析治疗上机前血液化验的中性粒细胞计数、淋巴细胞计数、单核细胞计数、血小板计数、血红蛋白、红细胞分布宽度(red blood cell distribution width,RDW)、C反应蛋白(C-reactive protein,CRP)、白蛋白、肌酐、尿素氮、尿酸、β2-微球蛋白、铁蛋白、甲状旁腺激素(parathormone,PTH)、钾、钙、磷、镁、高密度脂蛋白(high-density lipoprotein,HDL)以及透析结束时的肌酐、尿素氮。计算NLR、MLR、PLR、CAR、MHR。计算尿素清除指数(urea clearance index,Kt/V)的公式为Kt/V=−ln(R−0.008×t)+(4−3.5×R)×UF/W,R为透析后尿素氮/透析前尿素氮,t表示透析时间,UF表示超滤量,W是干体重。
四 研究终点
通过电话沟通、门诊或上门回访等方式对患者进行病情随访,随访至患者死亡或者到达随访终点(2022年11月30日)。
五 统计学方法
使用SPSS Statistics 20.0进行统计分析。计量资料采用Shapiro-Wilk检验进行正态性检验,符合正态分布的计量资料以$\bar{x} \pm s $表示,采用独立样本t检验进行组间比较,采用Levene检验进行方差齐性检验;不符合正态分布的计量资料以M(Q1,Q3)表示,采用Wilcoxon秩和检验进行组间比较。计数资料采用χ2检验进行组间比较。采用Logistic回归进行多因素分析。采用Kaplan-Meier法进行生存分析,采用对数秩检验进行组间比较。采用受试者工作特征(receiver operating characteristic,ROC)曲线进行预测价值分析。P<0.05认为差异有统计学意义。
结 果
一 患者的一般资料
共筛查MHD患者141例,排除患有肿瘤性疾病患者7例、全身免疫性疾病患者4例、血液系统疾病患者3例、严重感染性疾病患者2例,长期口服激素患者1例,失访24例,最终纳入100例患者,至随访结束共死亡24例,生存76例。(表1)
表 1 患者一般资料Table 1. Baseline profiles of recruited patients项目 所有患者(n=100) 性别(例) 男 64 女 36 年龄(岁,$\bar{x} \pm s $) 66.61 ± 14.73 透析龄[月,M(Q1,Q3)] 40(31,74) 体重指数(kg/m2,$\bar{x} \pm s $) 22.89 ± 3.51 透析通路(例) 动静脉内瘘 87 中心静脉置管 13 合并糖尿病(例) 35 原发病(例) 慢性肾炎 36 糖尿病肾脏疾病 31 高血压肾损害 24 多囊肾 8 过敏性紫癜性肾炎 1 随访时间[月,M(Q1,Q3)] 42.50(31.25,82.50) 死亡原因(例) 心脑血管疾病 14 消化道出血 2 感染 6 多器官功能衰竭 2 二 死亡组与生存组患者指标比较
两组患者性别分布、中性粒细胞计数、淋巴细胞计数、单核细胞计数、RDW、血红蛋白、血小板计数、PLR、白蛋白、铁蛋白、尿素氮、血肌酐、β2-微球蛋白、Kt/V、血尿酸、PTH、钾、镁、钙、磷差异均无统计学意义(P>0.05)。死亡组患者年龄大于生存组患者,差异有统计学意义(P<0.05);死亡组患者合并糖尿病比例、NLR、MLR、CRP、CAR、MHR高于生存组患者,差异均有统计学意义(P<0.05);死亡组患者HDL低于生存组患者,差异有统计学意义(P<0.05)。(表2)
表 2 死亡组与生存组患者指标比较Table 2. Comparison of parameters between death and survival groups指标 死亡组(n=24) 生存组(n=76) χ2/Z/t值 P值 性别[例(%)] 0.097 0.755 男 16(66.67) 48(63.16) 女 8(33.33) 28(36.84) 年龄(岁) 77.00(71.25,85.75) 64.00(52.25,73.75) −4.086 <0.001 合并糖尿病[例(%)] 13(54.17) 22(28.95) 5.099 0.024 中性粒细胞(×109/L,$\bar{x} \pm s $) 4.77 ± 1.74 4.15 ± 1.33 1.826 0.071 淋巴细胞(×109/L) 1.020(0.893,1.208) 1.115(0.863,1.390) −1.174 0.240 NLR 5.059(2.959,5.961) 3.582(2.746,4.468) −2.215 0.027 单核细胞(×109/L) 0.420(0.273,0.505) 0.330(0.263,0.500) −1.086 0.277 MLR 0.391(0.300,0.493) 0.317(0.227,0.411) −2.163 0.031 RDW(%) 48.000(46.000,51.075) 47.000(44.250,50.375) −1.074 0.283 血红蛋白(g/L,$\bar{x} \pm s $) 107.96 ± 16.23 110.47 ± 14.20 −0.731 0.467 血小板(×109/L,$\bar{x} \pm s $) 175.50 ± 64.63 173.33 ± 47.22 0.179 0.858 PLR 176.147(114.289,238.276) 147.264(123.700,198.589) −0.710 0.478 白蛋白(g/L,$\bar{x} \pm s $) 37.86 ± 3.23 39.62 ± 4.09 −1.920 0.058 铁蛋白(μg/L) 101.075(52.616,155.208) 107.985(56.513,224.843) −0.851 0.395 CRP(mg/L) 5.475(2.368,7.350) 2.410(1.025,5.475) −2.680 0.007 CAR(mg/g) 0.142(0.062,0.208) 0.061(0.027,0.144) −2.817 0.005 HDL(mmol/L) 0.840(0.725,1.018) 1.010(0.813,1.280) −2.741 0.006 MHR 0.457(0.340,0.598) 0.328(0.241,0.454) −2.857 0.004 尿素氮(mmol/L) 24.600(17.675,25.975) 24.950(21.150,28.825) −1.521 0.128 血肌酐(μmmol/L,$\bar{x} \pm s $) 732.76 ± 246.53 838.62 ± 286.87 −1.627 0.107 β2-微球蛋白(mg/L,$\bar{x} \pm s $) 22.99 ± 6.16 21.49 ± 4.96 1.222 0.225 Kt/V 1.350(1.283,1.655) 1.445(1.293,1.668) −0.803 0.422 尿酸(μmol/L) 359.0(305.7,456.6) 414.0(332.3,473.0) −1.695 0.090 PTH(ng/L) 349.30(200.90,486.33) 318.35(212.65,439.03) −0.488 0.625 钾(mmol/L,$\bar{x} \pm s $) 4.78 ± 0.89 4.52 ± 0.51 1.379 0.179 镁(mmol/L) 1.015(0.910,1.118) 0.985(0.933,1.108) −0.339 0.734 钙(mmol/L,$\bar{x} \pm s $) 2.13 ± 0.19 2.17 ± 0.20 −0.794 0.429 磷(mmol/L) 1.890(1.573,2.308) 1.815(1.490,2.170) −0.541 0.589 注:NLR为中性粒细胞/淋巴细胞比值;MLR为单核细胞/淋巴细胞比值;RDW为红细胞分布宽度;PLR为血小板/淋巴细胞比值;CRP为C反应蛋白;CAR为C反应蛋白/白蛋白比值;HDL为高密度脂蛋白;MHR为单核细胞/高密度脂蛋白比值;Kt/V为尿素清除指数;PTH为甲状旁腺激素;数据形式除标注外,均为M(Q1,Q3)。 三 多因素Logistic回归分析
在所有MHD患者中,以生存/死亡(0/1)为因变量,纳入单因素分析中差异有统计学意义的指标(当两指标存在相关性时,选择P值小的指标),包括:年龄、合并糖尿病、NLR、MLR、CAR、MHR,多因素Logistic回归分析提示年龄和MHR是MHD患者全因死亡的危险因素。(表3)
表 3 患者全因死亡影响因素Logistic回归分析(n=100)Table 3. Logistic regression analysis of influencing factors of all-cause mortality in patients(n=100)变量 β值 SE值 Wald χ2值 P值 OR值 OR值95%CI 常量 −9.230 2.193 17.715 <0.001 0 - 年龄 0.090 0.026 12.105 0.001 1.094 1.040~1.151 MHR 3.942 1.632 5.837 0.016 51.522 2.105~1261.214 注:MHR为单核细胞/高密度脂蛋白比值。 四 高MHR组和低MHR组生存分析
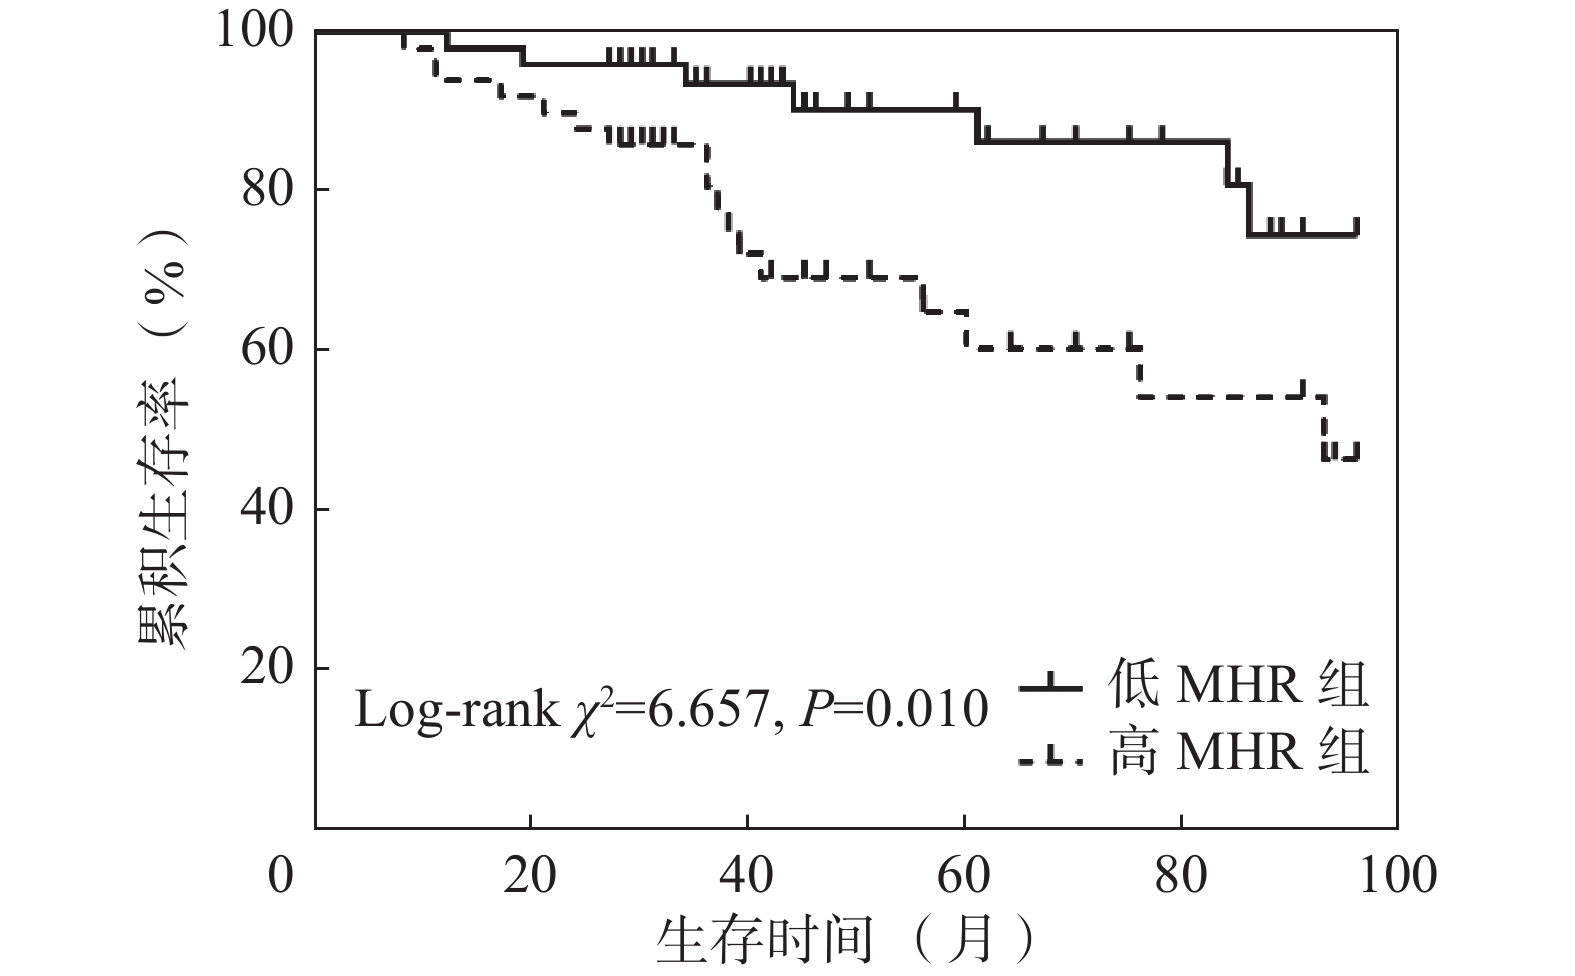
根据MHR中位数将患者分为两组:高MHR(MHR>0.3568)组(n=50)和低MHR(MHR≤0.3568)组(n=50)。高MHR组患者生存率66.00%,生存时间70.37(60.57,80.18)个月;低MHR组患者生存率86.00%,生存时间86.87(80.34,93.41)个月。高MHR组患者总体生存率低于低MHR组患者,差异有统计学意义(χ2=6.657,P=0.010)。(图1)
五 MHR、CAR、NLR、MLR对MHD患者全因死亡的预测价值
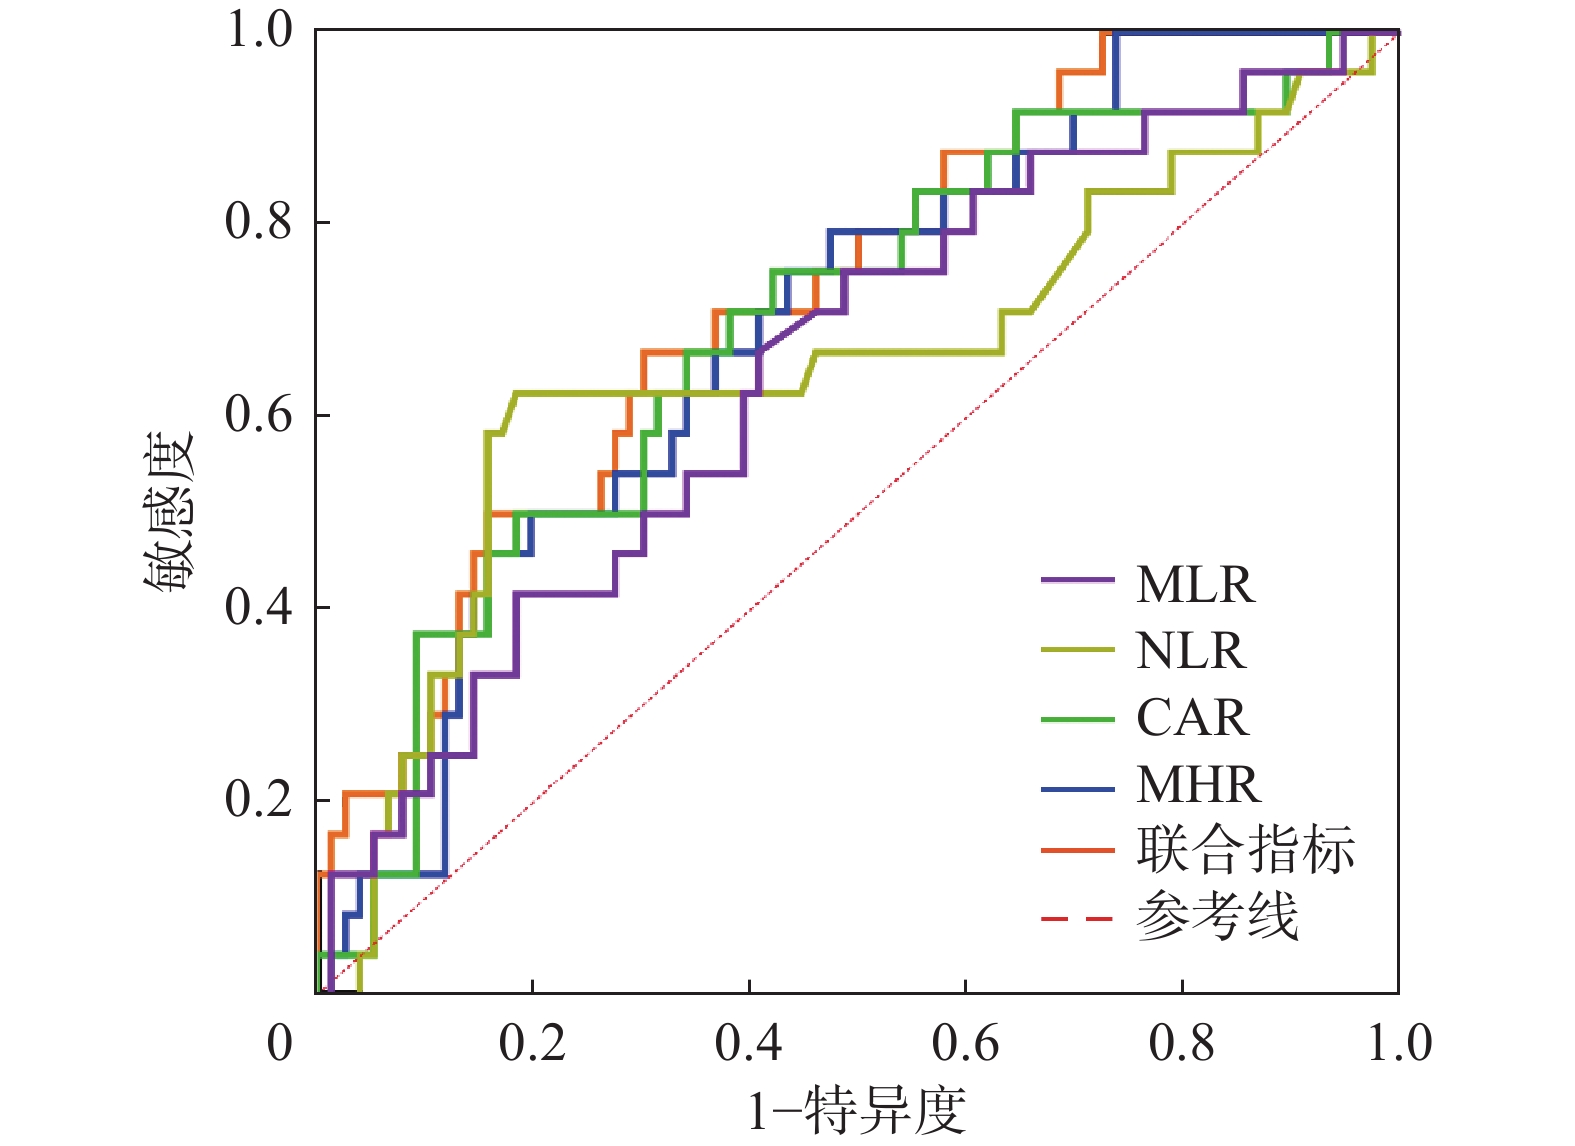
根据患者全因死亡绘制MHR、CAR、NLR、MLR以及四者联合的ROC曲线,选择约登指数最大值为截断值。(图2、表4)
表 4 MHR、CAR、NLR、MLR单独以及四者联合对患者全因死亡的预测价值Table 4. Predictive values of MHR/CAR/NLR/MLR alone and in combination for all-cause mortality in patients指标 AUC(95%CI) P值 截断值 灵敏度(%) 特异性(%) MHR 0.694(0.581~0.808) 0.004 0.3346 79.17 52.63 CAR 0.691(0.570~0.813) 0.005 0.0786 75.00 59.78 NLR 0.650(0.508~0.792) 0.027 4.7331 62.50 81.58 MLR 0.647(0.520~0.773) 0.031 0.3377 66.67 59.21 四者联合 0.740(0.631~0.850) <0.001 - 75.00 67.11 注:MHR为单核细胞/高密度脂蛋白比值;CAR为C反应蛋白/白蛋白比值;NLR为中性粒细胞/淋巴细胞比值;MLR为单核细胞/淋巴细胞比值;AUC为曲线下面积。 讨 论
微炎症状态是指一种由非病原微生物引起的、全身循环系统中炎症细胞与炎症蛋白增高的慢性非显性炎症状态,是引起慢性病患者各种并发症的一个重要原因[10-11]。大量研究显示,微炎症在慢性肾脏病患者中普遍存在,并导致透析患者的发病和死亡[12]。以往临床通常会采用白细胞介素(interleukin,IL)6、CRP、肿瘤坏死因子(tumor necrosis factor,TNF)α、IL-1等指标来反映机体微炎症状态,近年来,随着人们对MHD患者体内微炎症状态的认识逐渐深入,越来越多新型炎症指标随之出现。
HDL进行反向胆固醇转运,并且已知具有抗炎特性[13]。Iqbal等[14]的一项实验研究中证明,载脂蛋白A1(HDL颗粒中的主要脂蛋白部分)可以抑制巨噬细胞的趋化性和单核细胞的募集。单核细胞在组织中分化成巨噬细胞和树突细胞。巨噬细胞是人体抗菌防御所必需的,可通过产生炎症细胞因子而导致局部和全身炎症。单核细胞计数的增加与HDL水平降低都被证明和氧化应激及炎症有关,为此MHR可对机体内氧化应激水平与炎症反应水平进行反映[15-16]。许多研究都证实了MHR对慢性肾脏病、不同心血管疾病、慢性阻塞性肺疾病等疾病预后的预测价值[4,15-16]。而对于MHR在MHD患者全因死亡的预测价值上研究尚少。本研究显示,单因素分析中死亡组患者MHR高于生存组患者,多因素分析提示MHR为MHD患者死亡的危险因素。将MHR根据中位数分为高低两组,发现低MHR组患者总体生存率高于高MHR组患者,差异有统计学意义。综合以上结果说明,MHR与MHD患者全因死亡密切相关。
先前的研究中,NLR、MLR和PLR对血液透析患者死亡的预测价值得出了不一致的结论[5-8]。也就是说这三者对血液透析患者的预后都有一定的预测价值,但它们的预测能力在不同的研究中有所不同,因此,三者的组合在理论上可能更全面地反映身体的炎症状态。有学者通过由NLR、MLR和PLR三者构建的炎症评分系统对MHD患者的预后进行预测,结果显示随着炎症评分的增加,血液透析患者全因和心血管死亡的风险增加[3]。另外有研究显示,CAR水平升高是腹膜透析患者全因死亡和心脑血管死亡的独立危险因素[9]。本研究结果提示,死亡组患者NLR、MLR、CAR、MHR均高于生存组患者,PLR在两组患者间差异无统计学意义。故本研究选择了MHR、CAR、NLR、MLR四个指标,通过分别和联合应用ROC曲线分析,来评估对MHD患者预后的价值。结果显示MHR、CAR、NLR、MLR均对MHD患者全因死亡有一定预测价值,但MHR要优于其他三个指标。联合四者,则曲线下面积更大,提示对MHD患者全因死亡的预测价值更好。相较于IL-6、TNF-α等传统炎症因子,MHR、CAR、NLR以及MLR具有操作简单、价格低廉、立即获得、可重复检测等特点,在社区及基层医疗机构可以获得很大优势,便于推广。
综上所述,越来越多的研究通过利用全血细胞计数参数进行两两比值或与一些生化指标(如白蛋白、HDL)进行比值,作为新型炎症指标用于预测疾病预后。而本研纳入了5种新型炎症指标,包括MHR、NLR、MLR、PLR、CAR,通过数据统计分析发现MHR与MHD患者的预后相关性最强,可作为患者日常管理的监测指标。联合多个新型炎症指标对疾病进行预测价值应该更高,对于联合的种类以及方法值得进一步研究。本研究存在一定局限性,为单中心回顾性研究,样本量少,需要大样本前瞻性研究加以验证。
-
表 1 患者一般资料
Table 1 Baseline profiles of recruited patients
项目 所有患者(n=100) 性别(例) 男 64 女 36 年龄(岁,$\bar{x} \pm s $) 66.61 ± 14.73 透析龄[月,M(Q1,Q3)] 40(31,74) 体重指数(kg/m2,$\bar{x} \pm s $) 22.89 ± 3.51 透析通路(例) 动静脉内瘘 87 中心静脉置管 13 合并糖尿病(例) 35 原发病(例) 慢性肾炎 36 糖尿病肾脏疾病 31 高血压肾损害 24 多囊肾 8 过敏性紫癜性肾炎 1 随访时间[月,M(Q1,Q3)] 42.50(31.25,82.50) 死亡原因(例) 心脑血管疾病 14 消化道出血 2 感染 6 多器官功能衰竭 2 表 2 死亡组与生存组患者指标比较
Table 2 Comparison of parameters between death and survival groups
指标 死亡组(n=24) 生存组(n=76) χ2/Z/t值 P值 性别[例(%)] 0.097 0.755 男 16(66.67) 48(63.16) 女 8(33.33) 28(36.84) 年龄(岁) 77.00(71.25,85.75) 64.00(52.25,73.75) −4.086 <0.001 合并糖尿病[例(%)] 13(54.17) 22(28.95) 5.099 0.024 中性粒细胞(×109/L,$\bar{x} \pm s $) 4.77 ± 1.74 4.15 ± 1.33 1.826 0.071 淋巴细胞(×109/L) 1.020(0.893,1.208) 1.115(0.863,1.390) −1.174 0.240 NLR 5.059(2.959,5.961) 3.582(2.746,4.468) −2.215 0.027 单核细胞(×109/L) 0.420(0.273,0.505) 0.330(0.263,0.500) −1.086 0.277 MLR 0.391(0.300,0.493) 0.317(0.227,0.411) −2.163 0.031 RDW(%) 48.000(46.000,51.075) 47.000(44.250,50.375) −1.074 0.283 血红蛋白(g/L,$\bar{x} \pm s $) 107.96 ± 16.23 110.47 ± 14.20 −0.731 0.467 血小板(×109/L,$\bar{x} \pm s $) 175.50 ± 64.63 173.33 ± 47.22 0.179 0.858 PLR 176.147(114.289,238.276) 147.264(123.700,198.589) −0.710 0.478 白蛋白(g/L,$\bar{x} \pm s $) 37.86 ± 3.23 39.62 ± 4.09 −1.920 0.058 铁蛋白(μg/L) 101.075(52.616,155.208) 107.985(56.513,224.843) −0.851 0.395 CRP(mg/L) 5.475(2.368,7.350) 2.410(1.025,5.475) −2.680 0.007 CAR(mg/g) 0.142(0.062,0.208) 0.061(0.027,0.144) −2.817 0.005 HDL(mmol/L) 0.840(0.725,1.018) 1.010(0.813,1.280) −2.741 0.006 MHR 0.457(0.340,0.598) 0.328(0.241,0.454) −2.857 0.004 尿素氮(mmol/L) 24.600(17.675,25.975) 24.950(21.150,28.825) −1.521 0.128 血肌酐(μmmol/L,$\bar{x} \pm s $) 732.76 ± 246.53 838.62 ± 286.87 −1.627 0.107 β2-微球蛋白(mg/L,$\bar{x} \pm s $) 22.99 ± 6.16 21.49 ± 4.96 1.222 0.225 Kt/V 1.350(1.283,1.655) 1.445(1.293,1.668) −0.803 0.422 尿酸(μmol/L) 359.0(305.7,456.6) 414.0(332.3,473.0) −1.695 0.090 PTH(ng/L) 349.30(200.90,486.33) 318.35(212.65,439.03) −0.488 0.625 钾(mmol/L,$\bar{x} \pm s $) 4.78 ± 0.89 4.52 ± 0.51 1.379 0.179 镁(mmol/L) 1.015(0.910,1.118) 0.985(0.933,1.108) −0.339 0.734 钙(mmol/L,$\bar{x} \pm s $) 2.13 ± 0.19 2.17 ± 0.20 −0.794 0.429 磷(mmol/L) 1.890(1.573,2.308) 1.815(1.490,2.170) −0.541 0.589 注:NLR为中性粒细胞/淋巴细胞比值;MLR为单核细胞/淋巴细胞比值;RDW为红细胞分布宽度;PLR为血小板/淋巴细胞比值;CRP为C反应蛋白;CAR为C反应蛋白/白蛋白比值;HDL为高密度脂蛋白;MHR为单核细胞/高密度脂蛋白比值;Kt/V为尿素清除指数;PTH为甲状旁腺激素;数据形式除标注外,均为M(Q1,Q3)。 表 3 患者全因死亡影响因素Logistic回归分析(n=100)
Table 3 Logistic regression analysis of influencing factors of all-cause mortality in patients(n=100)
变量 β值 SE值 Wald χ2值 P值 OR值 OR值95%CI 常量 −9.230 2.193 17.715 <0.001 0 - 年龄 0.090 0.026 12.105 0.001 1.094 1.040~1.151 MHR 3.942 1.632 5.837 0.016 51.522 2.105~1261.214 注:MHR为单核细胞/高密度脂蛋白比值。 表 4 MHR、CAR、NLR、MLR单独以及四者联合对患者全因死亡的预测价值
Table 4 Predictive values of MHR/CAR/NLR/MLR alone and in combination for all-cause mortality in patients
指标 AUC(95%CI) P值 截断值 灵敏度(%) 特异性(%) MHR 0.694(0.581~0.808) 0.004 0.3346 79.17 52.63 CAR 0.691(0.570~0.813) 0.005 0.0786 75.00 59.78 NLR 0.650(0.508~0.792) 0.027 4.7331 62.50 81.58 MLR 0.647(0.520~0.773) 0.031 0.3377 66.67 59.21 四者联合 0.740(0.631~0.850) <0.001 - 75.00 67.11 注:MHR为单核细胞/高密度脂蛋白比值;CAR为C反应蛋白/白蛋白比值;NLR为中性粒细胞/淋巴细胞比值;MLR为单核细胞/淋巴细胞比值;AUC为曲线下面积。 -
[1] Dai L,Golembiewska E,Lindholm B,et al. End-stage renal disease, inflammation and cardiovascular outcomes[J]. Contrib Nephrol,2017,191:32-43. DOI: 10.1159/000479254.
[2] Wang YH,Gao L. Inflammation and cardiovascular disease associated with hemodialysis for end-stage renal disease[J]. Front Pharmacol,2022,13:800950. DOI: 10.3389/fphar.2022.800950.
[3] Liao JX,Wei DY,Sun CH,et al. Prognostic value of the combination of neutrophil-to-lymphocyte ratio, monocyte-to-lymphocyte ratio and platelet-to-lymphocyte ratio on mortality in patients on maintenance hemodialysis[J]. BMC Nephrol,2022,23(1):393. DOI: 10.1186/s12882-022-03020-1.
[4] Cicek MC,Gunseren KO,Aydin YM,et al. Monocyte-to-high-density lipoprotein cholesterol ratio is independently associated with all-cause mortality in deceased donor kidney transplant recipients[J]. Exp Clin Transplant,2021,19(10):1041-1047. DOI: 10.6002/ect.2021.0024.
[5] Yaprak M,Turan MN,Dayanan R,et al. Platelet-to-lymphocyte ratio predicts mortality better than neutrophil-to-lymphocyte ratio in hemodialysis patients[J]. Int Urol Nephrol,2016,48(8):1343-1348. DOI: 10.1007/s11255-016-1301-4.
[6] Demirtas S,Karahan O,Yazici S,et al. The relationship between complete blood count parameters and Fontaine’s Stages in patients with peripheral arterial disease[J]. Vascular,2014,22(6):427-431. DOI: 10.1177/1708538114522227.
[7] Xiang FF,Chen RY,Cao XS,et al. Monocyte/lymphocyte ratio as a better predictor of cardiovascular and all-cause mortality in hemodialysis patients: a prospective cohort study[J]. Hemodial Int,2018,22(1):82-92. DOI: 10.1111/hdi.12549.
[8] Balta S,Ozturk C. The platelet-lymphocyte ratio: a simple, inexpensive and rapid prognostic marker for cardiovascular events[J]. Platelets,2015,26(7):680-681. DOI: 10.3109/09537104.2014.979340.
[9] 罗亚维,冯胜,沈华英,等. C反应蛋白/白蛋白比值是腹膜透析患者死亡的独立影响因素[J]. 中华肾脏病杂志,2022,38(6):528-535.DOI: 10.3760/cma.j.cn441217-20211011-00073. Luo YW,Feng S,Shen HY,et al. C-reactive protein to albumin ratio is an independent influencing factor of mortality in peritoneal dialysis patients[J]. Chin J Nephrol,2022,38(6):528-535. DOI: 10.3760/cma.j.cn441217-20211011-00073.
[10] Sato M,Inaba M,Yamada S,et al. Efficacy of romosozumab in patients with osteoporosis on maintenance hemodialysis in Japan; an observational study[J]. J Bone Miner Metab,2021,39(6):1082-1090. DOI: 10.1007/s00774-021-01253-y.
[11] Youssef AM,Elghoneimy HA,Helmy MW,et al. Effect of amlodipine versus bisoprolol in hypertensive patients on maintenance hemodialysis: a randomized controlled trial[J]. Medicine,2021,100(51):e28322. DOI: 10.1097/MD.0000000000028322.
[12] Çankaya E,Bilen Y,Keles M,et al. Neutrophil-lymphocyte ratio is significantly decreased in preemptive renal transplant patients[J]. Transplant Proc,2015,47(5):1364-1368. DOI: 10.1016/j.transproceed.2015.04.052.
[13] Murphy AJ,Woollard KJ,Hoang A,et al. High-density lipoprotein reduces the human monocyte inflammatory response[J]. Arterioscler Thromb Vasc Biol,2008,28(11):2071-2077. DOI: 10.1161/ATVBAHA.108.168690.
[14] Iqbal AJ,Barrett TJ,Taylor L,et al. Acute exposure to apolipoprotein A1 inhibits macrophage chemotaxis in vitro and monocyte recruitment in vivo[J]. Elife,2016,5:e15190. DOI: 10.7554/eLife.15190.
[15] Yakar HI,Kanbay A. Could monocyte level/HDL cholesterol ratio predict cardiovascular diseases in patients with COPD?[J]. Niger J Clin Pract,2020,23(4):450-455. DOI: 10.4103/njcp.njcp_54_19.
[16] Haybar H,Pezeshki SMS,Saki N. Evaluation of complete blood count parameters in cardiovascular diseases: an early indicator of prognosis?[J]. Exp Mol Pathol,2019,110:104267. DOI: 10.1016/j.yexmp.2019.104267.


 下载:
下载:


.png)